Nearpod version available
The Mathematics Behind Progressive, Regressive, and Proportional Taxes
Objective
Students will be able to:
- Define proportional, progressive and regressive taxes.
- Create equations from a table or a graph to represent relationships between income and tax.
- Represent average tax ratio as an equation in two or more variables.
- Explain how the average tax ratio changes for different tax structures as income increases.

In this personal finance lesson, students will explore graphs to analyze the impact of different tax structures on families.
Resources
- Impact of Tax Structures on Households with different Incomes- powerpoint | pdf file
- Activity 1– Quiz, one copy for each student
- Activity 2– Money, one copy for each student, cut apart
- Activity 3– one copy for each student
- Activity 3- Answer Key
- Income and Taxes Interactive- technology.councilforeconed.org/taxes-and-income/
PREPARATION: students can take the quiz (Activity 1) the day before the lesson is taught or as warm up for the lesson
Procedure
Taxation is the process in which a charge is imposed upon a taxpayer by government. Taxes are compulsory payments to governments by households and businesses. Tax structures impact households with different incomes differently. Representations of tax structures serve as a context for creating tables, graphs, and equations. An equation is a mathematical sentence that contains an equal sign. Equations use constants and variables to represent relationships between quantities. Variables are symbols used to represent numbers. We can analyze the impact of tax structure on households with different incomes by creating tables, graphs and equations. In the case of taxes, the average tax ratio can be represented as slopes of line segments between the origin and points of interest on graphs, representing relationships between income and tax.
- Tell students that this lesson is about taxes. Define taxes as compulsory payments to governments by households and businesses. Ask students for examples of taxes. [Answers will vary but might include sales tax, income tax, and property tax.]
- Give each student a copy of Activity 1.
- Announce that the students will take a quiz and they will earn income in the form of money for each problem they answer correctly. The income earned, which is based on the number of correct answers to the quiz, will include a potential tax payment. For two correct answers, no tax payment will occur.
- After all students have finished the quiz, tell them that all of the statements in the quiz were true. Ask the students to determine how many problems they answered correctly.
- Ask the students to report the number of problems they answered correctly and use the money from Activity 2 to pay each student $5 for every problem they answered correctly. Students can earn up to $35. Be sure to keep a record of the number correct for each student.
- Collect tax from each student based on the number of correct answers on the quiz and the “income” distributed. If a student has one or two correct answers, they owe zero dollars in tax. For students who had greater than two correct answers, they will need to pay $1 for each problem correct over two. Students who correctly answered three questions would pay $1. Students who answered four questions correctly would pay $2. Students who answered five questions correctly would pay $3. Students who answered six questions correctly would pay $4. Students who answered seven questions correctly would pay $5.
- Give each student a copy of Activity 3. Direct students to look at the table and ask the following questions:
- How much income would a student who answered one question correctly earn? [$5] How much tax would the student pay? [$0]
- How much income would a student who answered two questions correctly earn?
[$10] How much tax would the student pay? [$0] - How much income would a student who answered three questions correctly earn?
[$15] How much tax would the student pay? [$1] - Continue by asking the amount of income earned and taxes paid for correct answers to questions four through seven.
- Ask the students what they notice about the relationship between total earnings and total taxes paid? [Answers will vary, but students may notice that the greater the total earnings the more taxes paid except for those who earned zero, $5, or $10.]
- Ask the students to graph the data from the table on their copy of Activity 3, number 1. Tell students to place the “Total Earnings Before Taxes” on the horizontal-axis and the “Total Taxes Paid” on the vertical-axis.
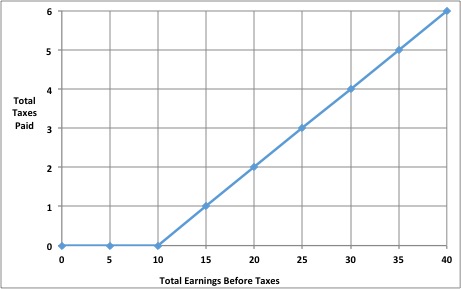
- Student scaling may vary, but the graphs should look like the following:

- Discuss the following:
- How did you determine the scale for the axes? [Students may say they considered the range of the variable (either earnings or total tax) and then divided the range by the number of points to find the distance increments. Other students may have decided to start their graph at (10, 0) because the tax for $5 of earnings was also zero.] Emphasize the importance of scaling the graph to enable the reader to see the tax paid for each dollar amount of earnings. Note: by starting with $10 and zero, it isn’t clear that there is a zero tax for $5 as well. Discuss the following?
- What amount of tax is paid on $5 of earnings? [$0] What amount of tax is paid on $30 of earning? [$4]
- Based on the graph, what is the relationship between earnings and taxes paid? [Students may say that as earnings increase taxes increase; or from zero to $10 in earnings the tax is $0, but from $10 to $35 the tax is $1 for each additional $5 earned.]
- Point out that on the interval [0,10] the tax paid is zero and on the interval [10, 35] the tax paid is $1 additional for each $5 more than $10.
- Ask students to answer questions 2 and 3 on Activity 3. Tell students the questions are asking them to represent the relationship between earnings and tax in the form of an equation. Point out that they may need more than one equation because the graph has two intervals of interest: [0,10] and [10, 35]. The equations are:
T = 0, when 0 ≤ I ≤ 10
T= .2(I-10)
Tell students that the equations represent a piecewise function, a special function used when one equation cannot represent all of the data provided.
- Ask students to complete question 4 on Activity 3. [Answers will vary but might include: “I think they will be the same because it is the same amount paid for every problem correct.”]
- Tell students they will be predicting the average tax ratio for a given amount of earnings.
- Demonstrate how to find the average tax ratio paid by a student who earned $15.

- Ask students to predict the average tax ratio paid by a student who earned $15. [Sample answer: .066]
- Ask students what they predict the average tax ratio will be for students who earned more than $15. [Average tax ratio will rise.]
- Demonstrate how to find the average tax ratio paid by a student who earned $15.
- Instruct students to complete the table in number 5 of Activity 3 by calculating the average tax ratio paid for each entry to three decimal places.
[Students’ tables should be filled in as follows.]
|
Total Earnings Before Taxes |
Total Taxes Paid |
Average tax ratio |
|
$5 |
$0 |
0 |
|
$10 |
$0 |
0 |
|
$15 |
$1 |
0.066 |
|
$20 |
$2 |
0.10 |
|
$25 |
$3 |
0.12 |
|
$30 |
$4 |
0.133 |
|
$35 |
$5 |
0.143 |
- Ask students to compare their predictions with average tax ratio found in the table. [Sample answers: I was surprised it went up; I thought it would stay the same because the tax was the same amount for each $5 earned.]
- Display Slide 1. Introduce the PowerPoint entitled “How Can Mathematics Be Used to Evaluate the Impact of Taxes on Households with Different Incomes?”
- Show Slide 2. Ask students to compare the graph they constructed to the graph on the slide. As you click, different colored segments appear on the graph. These segments represent the quantity of total earnings (x) and tax paid at that earning level (y). Check student graphs for accuracy, scaling, and labeling. [Some students may label or scale the axes differently.]
- Show Slide 3. Ask students if they thought the average tax ratio would increase, decrease, or stay the same. Click to introduce the table and ask students to compare their tables with the table on the screen. Ask them what pattern they notice for the average tax ratio? [It increases.] Teacher note: some people mistakenly believe this graph represents a proportional or flat tax. Slide 4 illustrates the average tax ratio as a slope of the segments between the origin and a point of interest on the graph. Not coincidently the slopes are increasing corresponding with the average tax ratios from Slide 3. This graph illustrates a progressive tax. Note: flat taxes often function in this manner. By exempting some income, the tax becomes progressive, even though it is “flat” or “proportional” after a certain exempted amount.
- Show Slide 4. Slowly click to show the individual segments and slopes. Point out the slope of each segment as it appears. For example, point out that the slope of the horizontal segment is 0 or the slope of the segment between point (0, 0) and point (15, 1) is 0.066. Continue with each segment. The individual segments will disappear as you progress through the slide. Then all segments will reappear at the end of the slide to demonstrate the average tax ratio (slope) increases as income increases. After the segments reappear, ask the students what they notice about the slope of the segments as the point of interest moves up the line. Point to different points representing earnings and tax on the graph as you ask the question. [Sample student responses: it increases or it gets steeper.]
- Show Slide 5. With this slide, revisit the equation relating total earnings and total tax. Ask the students, “What is the equation of the line between 0 and 10?”[y = 0] As you click, the equations the students have created will appear on the screen. Ask students if the equation for the interval [10, 35] is the same or different from what they found and to give an explanation for their answer. [Some students will notice that the equation you discussed earlier in the lesson for this interval is y = 0.2x-2 and the equation in the power point is y = 0.2(x-10). Other students will say the two equations are the same.]
- Invite students who noted the two equations are the same to illustrate why on the board. If no students think the two equations are the same, show the students that they can generate the equation y = 0.2x-2 by applying the distributive property to the equation y = 0.2(x-10). This algebraic transformation produces an equivalent equation.
- Use Slides 6-9. Discuss progressive taxes, regressive taxes, and proportional taxes.
- Display Slide 6. Define a progressive tax from the screen. Allow students enough time to write the definition on their copy of Activity 3, number 6a. Ask the students whether people with lower incomes ever pay a higher average tax rate than those with higher incomes. [Student answers will vary, but some may say “No, as income goes up, so does tax.” Others may say those with low incomes are not taxed at all.]
- Show Slide 7. Define a regressive tax and instruct students to write the definition of regressive tax on their copy of Activity 3, number 7a. Point out that sales tax on food, clothing, and medicine are considered regressive taxes. Those who earn lower incomes pay a larger portion of their income on these goods and thus a larger portion of their income on sales tax on these goods.
- Display Slide 8. Explain that the graphs showing representations of total earnings and total tax paid represent different tax structures. The graphs also have different characteristics. Progress through the slide by clicking and pointing out where the y-intercepts are on each graph. Instruct the students to create the graphs on their copy of Activity 3, 6b, and 7b.
- Show Slide 9. Point out the y-intercept is at 0. Define proportional tax and instruct students to record the definition on their copy of Activity 3, number 8a. Instruct students to draw a graph showing a proportional tax on their copy of Activity 3, number 8b.
- What conclusions can you draw about the impact of different tax structures on households with different incomes? [Suggested responses: different tax structures affect different earners in different ways.] Discuss the following:
- How does a regressive tax affect lower-income households versus higher-income households? [A regressive tax ratio disproportionately takes income from lower income households because it taxes them at a higher average tax ratio.]
- How does a progressive tax affect higher-income households versus lower-income households? [A progressive tax ratio disproportionately takes income from higher income households because it taxes them at a higher average tax ratio.]
- Review progressive, regressive and proportional taxes using the interactive found here: technology.councilforeconed.org/taxes-and-income/.
- Define regressive, progressive, and proportional taxes. [With a regressive tax, lower-income earners pay a higher percentage of their income in tax than higher-income earners. With a progressive tax, higher-income earners pay a higher-percentage of their income in tax. With a proportional tax, all income earners pay the same percentage of their income in tax.]
- What conclusions can you draw about the impact of different tax structures on households with different incomes? [Suggested responses: a regressive tax ratio disproportionately takes income from lower income households because it taxes them at a higher average tax ratio: a progressive tax ratio disproportionately takes income from higher income households because it taxes them at a higher average tax ratio.]
- How can we show the average tax ratio on a graph representing the relationship between a person’s income and the amount of tax paid? [Suggested responses: the average tax ratio can be represented by the slope of the segment between the origin and a point of interest on the graph.]
- Explain how the average tax ratio changes for different tax structures as income increases. [Suggested responses: with a progressive tax, as income increases, average tax ratio increases: with a regressive tax, as income increases average tax ratio decreases; as income increases, average tax ratio remains constant for a proportional tax.]
- Given an equation that relates income to tax paid, how can we use the graph to determine the impact of the average tax ratio on families with different incomes? [Suggested student response: if the y-intercept of the graph is above 0 and is a linear function, then the graph represents a regressive tax. With a regressive tax, those who earn lower incomes pay a higher percentage of their income in tax; they have a higher average tax ratio.]
- How can we create equations representing relationships between income and tax? [Suggested response: create a table of income and taxes and graph the data. Then create an equation that fits the data.]
- Note: sometimes students confuse the Average Tax Ratio and the Marginal Tax Rate. This lesson does not address or utilize the Marginal Tax Rate. If there is any confusion between the Average Tax Ratio and the slope of the tax function itself, explain that the slope of the tax equation is NOT the appropriate equation to determine if a tax is progressive, regressive, or proportional. The slope of the tax equation is called the marginal tax rate. In other words, it is the extra tax paid based on an extra dollar of income.
Assessment
Multiple Choice
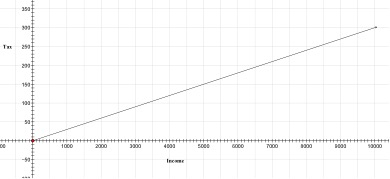
- Which of the following equations represents the relationship in the graph below between Tax, T, family income, I, and proportional tax, r, when r is 0.03?

- T = rI
- T = I + r
- [T = 0.03I]
- T = I + 0.03
- An example of a progressive tax is:
- Federal tax on gasoline.
- Federal sales tax.
- Federal social security tax.
- [Federal personal income tax.]
- Person A has an income of $100,000 and person B has an income of $20,000. If both must pay a sales tax of $1,000, which statement is true?
- Person A pays a higher percentage of income in taxes, making the tax progressive.
- Person B pays a higher percentage of income in taxes, making the tax progressive.
- [Person A pays a lower percentage of income in taxes, making the tax regressive.]
- Person B pays a lower percentage of income in taxes, making the tax regressive.
Constructed Response
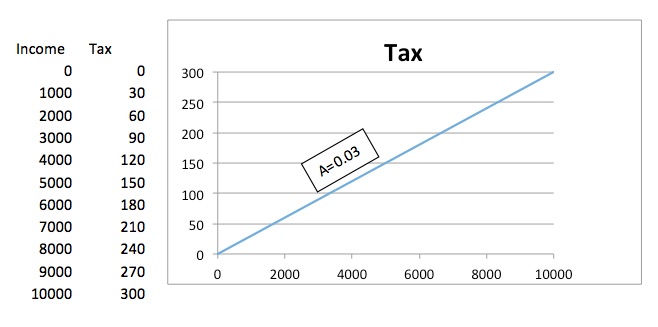
- A member of Congress proposes a proportional tax of 0.03 on income to replace the current federal personal income tax. Generate an equation for the average tax ratio, A, and given income, I. Graph the equation and use the graph to argue that a proportional tax is or is not fair.


[Possible student answers: the proportional tax is fair because it taxes everyone at a constant ratio: the tax is fair because it takes a smaller amount from people with less income: the proportional tax is not fair because the amount paid by a lower income household leaves less disposable income than a higher income household: the tax is not fair because lower income households have to give up more necessities than higher income households.]

